
A 1,300-year-old rook?
Science News picks up a really old game with a shaped stone from the desert of Jordan that might well have been the oldest chess […]
Science News picks up a really old game with a shaped stone from the desert of Jordan that might well have been the oldest chess […]
Science News proves that there’s always something new to figure out – in this case, with one of the most common and worked-with metals we […]
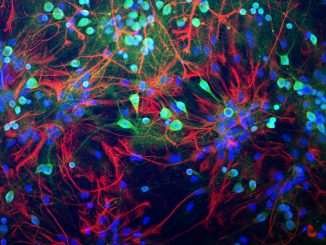
Click to embiggen Glia are the cells around neurons that manufacture myelin (the insulation around nerve cells), help repair cell damage and, apparently, have something […]
Science News reports on a computer algorithm that has analyzed satellite imagery to detect a previously unknown humanoid figure, sketched out centuries ago, among the […]
Science Immunology has a study that shows a low-carb, high-fat diet similar to Atkins and other keto diets seems to confer protection against flu and […]
It happens when we sleep, says Scientific American. It happens in cells that aren’t even neurons: A new study from the University of Toronto, published […]
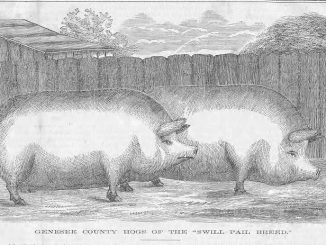
Click to embiggen Swill-pail hogs from upstate New York, as featured on the front page of Moore’s Rural New-Yorker, a delightful paper that promised “Agriculture, […]
Inverse covers an invention that should invisibly make a difference in some of the world’s hungriest communities, beating back malnutrition-based diseases with super-tiny capsules of […]
From SportDiver‘s “Ask a Marine Biologist” column comes a question about a band that might have lost some human relevance, but is still aiming for […]
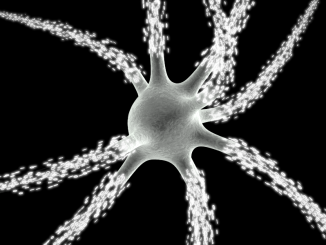
Click to embiggen slightly A nerve, an electric cell, a node in a network. A place and size where electricity meets chemistry inside our bodies. […]
ABC News (Australia) shares the findings of a Mexican expedition that has discovered a trove of mammoth bones in what appears to have been a […]
Ars Technica is (or rather, researchers they’re reporting on are) quietly taking over Alexa and other smart-home devices with inaudible – and sometimes invisible – […]
Nature has research (from Joule) that brings us closer to an electric filling station for battery-powered cars, thanks to the discovery that raising the temperature […]
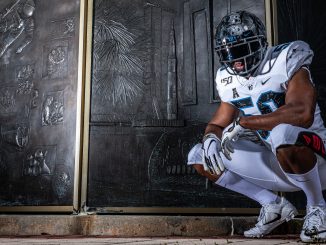
Click to embiggen vastly UCF, the University of Central Florida, is the university closest to the Kennedy Space Center, and has a rivalry with the […]
Nature reveals research in Science and Science Immunology that describes a one hidden risk of measles – that by catching it, you’ll also become more […]
Copyright © 2026 | WordPress Theme by MH Themes